It’s no surprise to anyone that planning a webinar takes careful attention and precision. Whether you’ll be having free or paid webinars, you should be looking at all the aspects and stages of webinar planning and preparation. The truth is, it also pays to sit back, research, and simply take note of various webinar statistics. These statistics will help put things into perspective for you and help you plan everything you need for your webinar event. Below are some important webinar statistics you need to know:
Webinar Usage Statistics
- 89% of the hosts claimed that webinar is the best platform to showcase and grow their business.
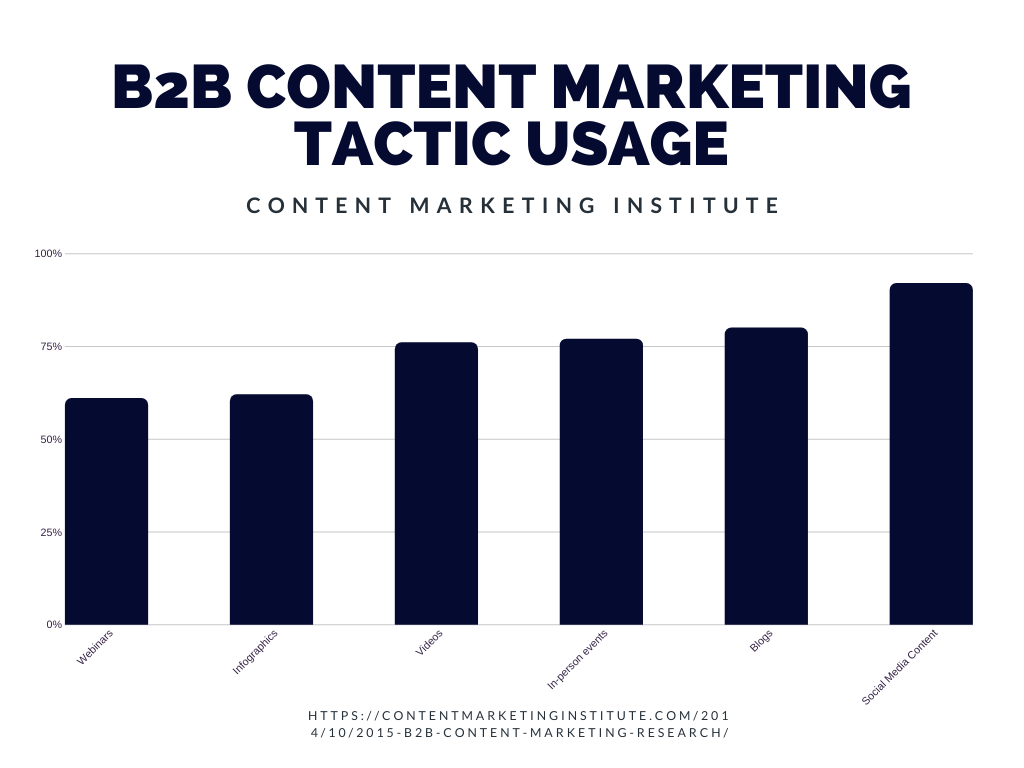
- According to the Content Marketing Institute, 61% of marketers use webinars as a tactic as part of their content marketing strategy. Other tactics include social media content, blogs, in-person events, videos, infographics, and more.
- 73% of B2B marketers claim that a webinar is the best way to generate high-quality leads. This means that these marketers continue to see positive results when it comes to lead generation through webinars.
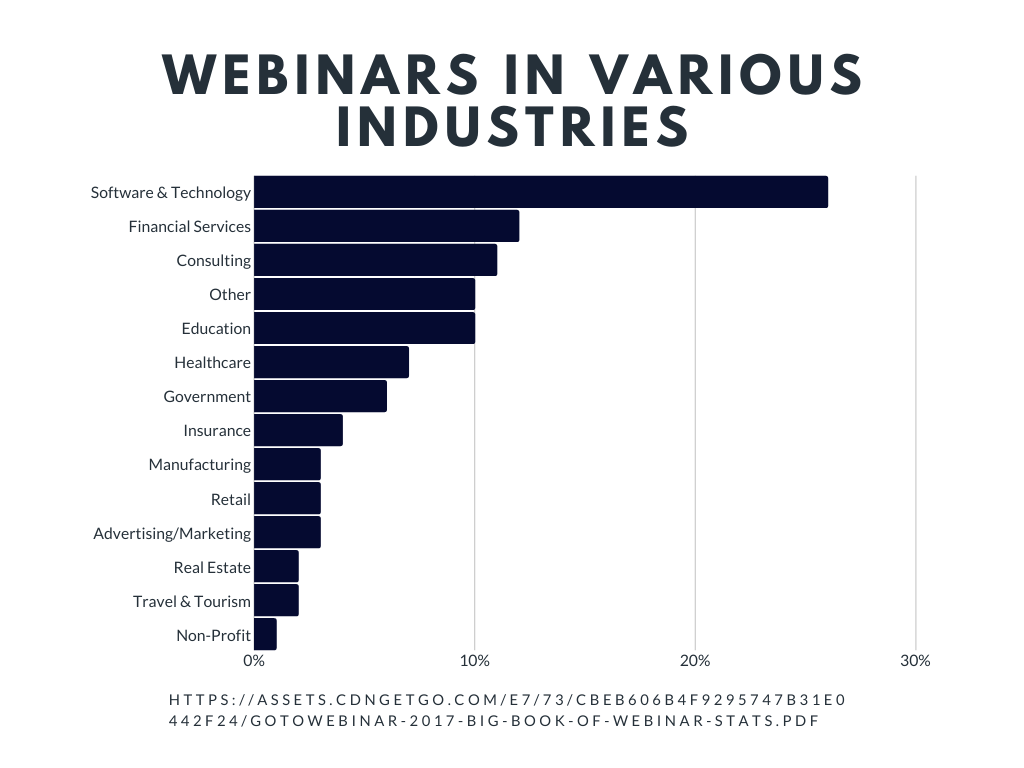
- In 2017, the Software & Technology industry produced the most webinars (26%) produces the most webinars. Even until now, their sector has produced the most webinars out of all industries.

- According to Smart Insights, the average length of a webinar is 39 minutes and the average view time is 22 minutes.
Pre-webinar Statistics
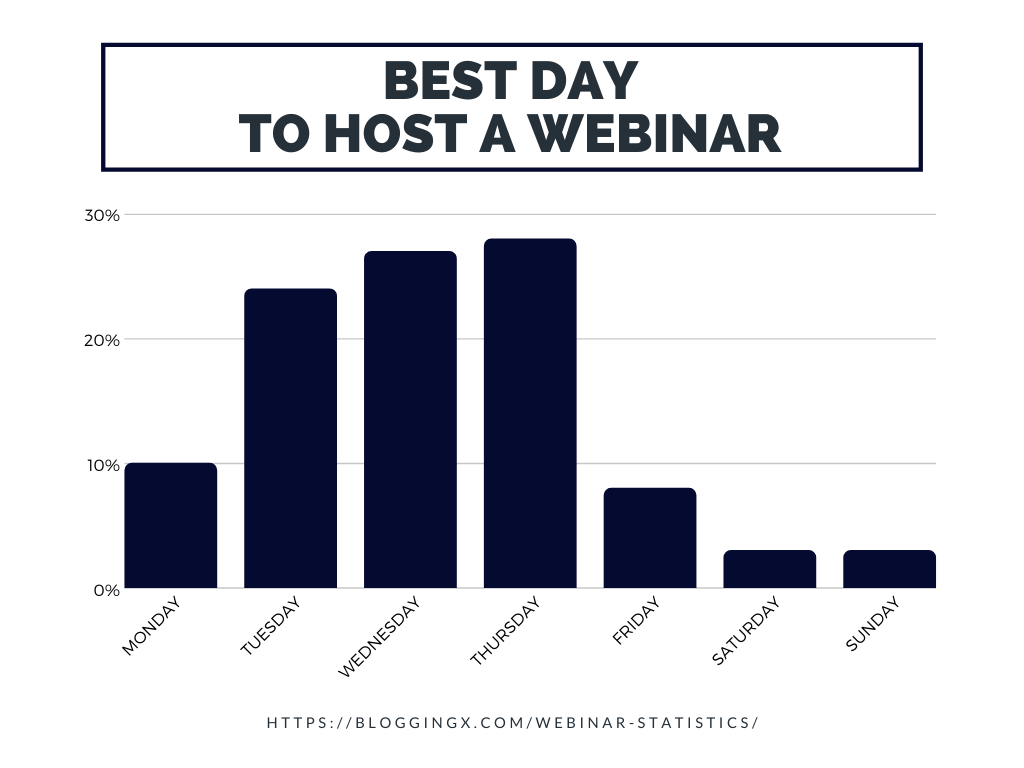
- The best day to host a webinar is on a weekday, specifically Wednesdays and Thursdays. BloggingX reports from a source that 27% attended on Wednesday and 28% of registrants attended the webinar on Thursday. Other days rank low in comparison.

- The average number of webinar registration is 260, but the average webinar attendance rate is only 40-50% of the people who have registered according to Outgrow. This shows that getting people to register and attend the live session is important.
- Outgrow also reports from a source that 57% of webinar registrations come from emails. This suggests that sending webinar invites through email is quite, if not the most, effective promoting strategy.
- Additionally, according to BloggingX, the highest number of email registrations was on Wednesday with a rate of 23%.
Consumer Behaviour Statistics
- BigMarker reports that 92% of webinar attendees want a live question and answer session at the end of the webinar. This is expected as a Q&A session is engaging and it lets the host provide more valuable insights to the audience.
- Most of the webinar attendees will not register until it’s the day of the live session. BigMarker also reports that 29% of your attendees until the day of the event itself. Additionally, the week leading to the event gets the most registrations as reported by BloggingX.
- Outgrow reports that 48% of people said that webinars were least enjoyable when there was a poor presenter. This just proves that having an excellent speaker or presenter holds a lot of significance.
Post-webinar Statistics
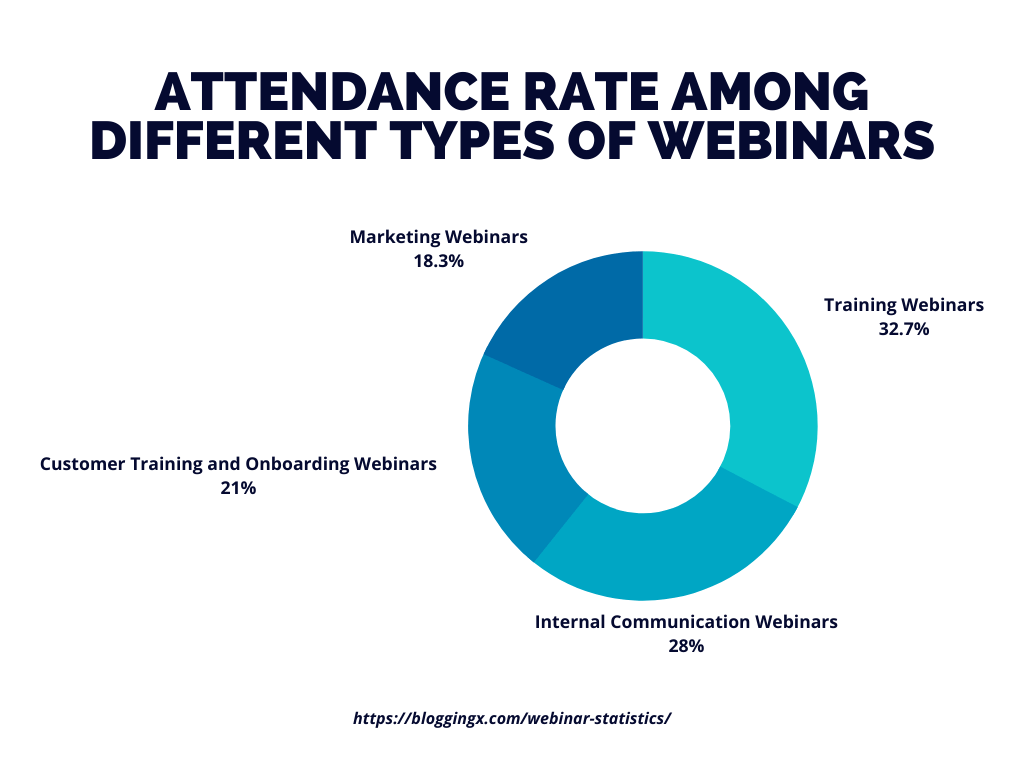
- The average attendance rate for training webinars is at its highest at 65.5% reported by BloggingX. Next is internal communication webinars with a 56.2% attendance rate, customer training and onboarding webinars with a 42.1 % attendance rate, and marketing webinars with an average attendee rate of 36.6%.

- According to Outgrow, 94% of webinar hosts make events available on-demand after the live event. Making your webinars available on-demand is a great practice when running paid webinars.
- Additionally, DMNews.com reports that no less than 35% of webinar attendees consume the content after the live session.
- Finances Online reports that webinars are among the top three most effective lead generation strategies witch a 61% rate of effectiveness. This aligns with the belief among marketers that webinars generate high-quality leads.
These various webinar statistics will provide you the insights you need for your own webinar strategy. Keep these key webinar statistics in mind and let them guide you as you plan your webinar.


